Go to AgTreks Home


Note: Going home clears all of these panels.

Synchronize panels by clicking the panel directional buttons found at the top of the panel.

Capital Investments

CapitalInvestments
Graph showing benefits and costs of capital investments over time.
Tech Story: Capital Investments, Agricultural Machinery
Describes the economics of capital investments in agricultural machinery.
ViewsSelect
CapitalInvestments
Agricultural Production, Capital Investment Benefits and Costs Graph. v216a
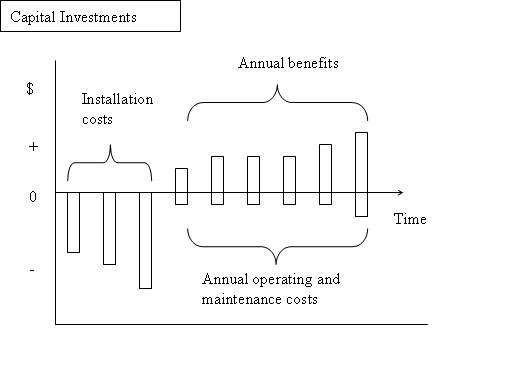
Tech Story: Capital Investments, Livestock
Describes the economics of livestock capital investments
ViewsSelect

Profit Maximization

ProfitMaximization
Agricultural Production, Profit Maximization Graph description
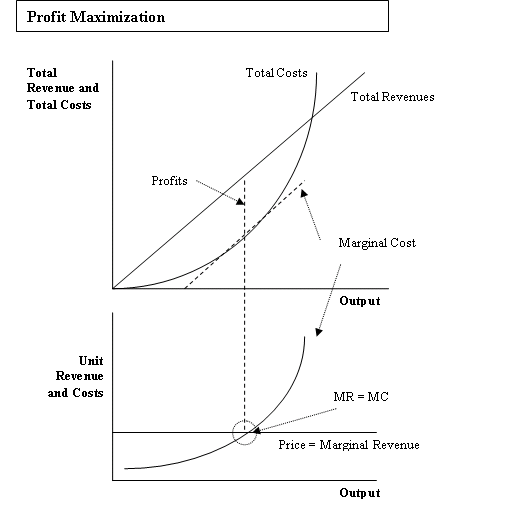
Tech Story: Profit Maximization, Crop Production
Describes the economics of crop production
ViewsSelect
ProfitMaximization
Agricultural Production, Profit Maximization Graph description
Tech Story: Profit Maximization, Livestock Production
Describes the economics of livestock production
ViewsSelect

Adaptive Efficiency

AdaptiveEfficiency
Outlines the process of economic and institutional change.
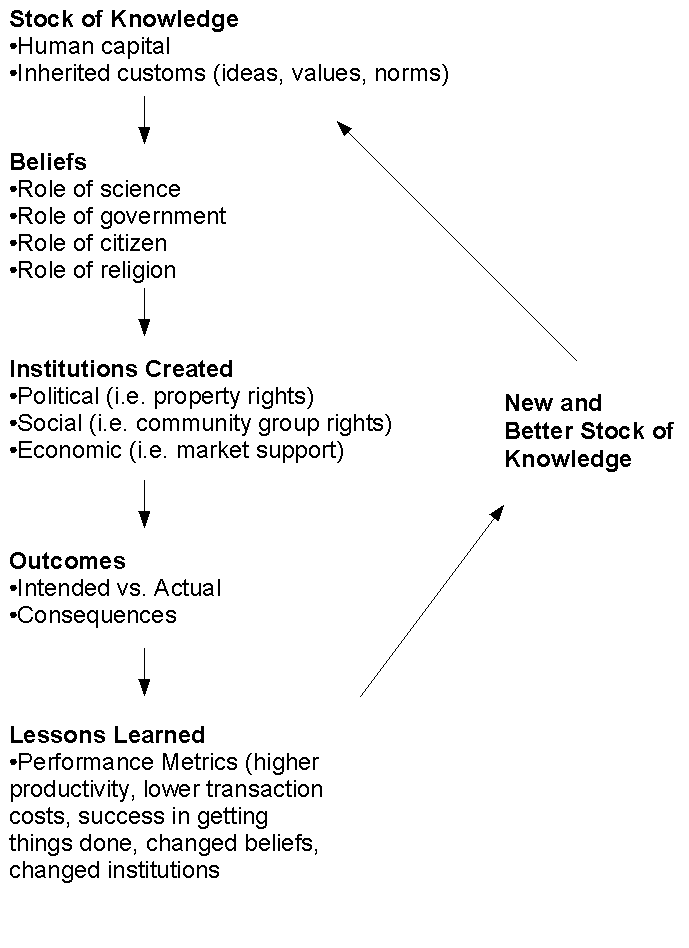
Tech Story: Adaptive Efficiency - Summary
This story summarizes the process of adaptive efficiency.
ViewsSelect

Economic Optimum Nitrogen Rate

EconomicOptimumNRate
Graph showing the relation between an economic optimum nitrogen rate and the corn - nitrogen price ratio.
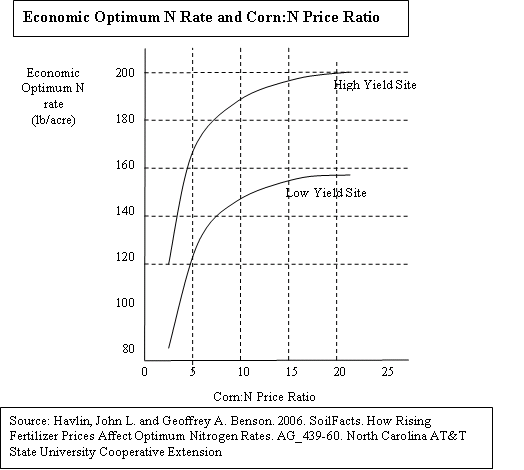
Tech Story: Economic Optimum Nitrogen Rate - Summary
Summary of the economic optimum nitrogen rate.
ViewsSelect

Externalities

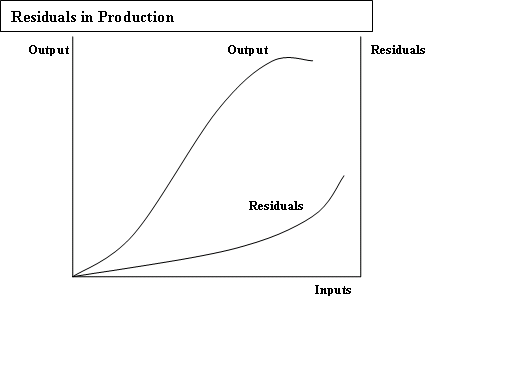
ResidualsinProduction
Graph plotting output and residuals as a function of input use.
Tech Story: Externalities - Crop Production
Externalities - Crop Production description
ViewsSelect

Fixed Costs

FixedCosts
Graph showing fixed cost by output.
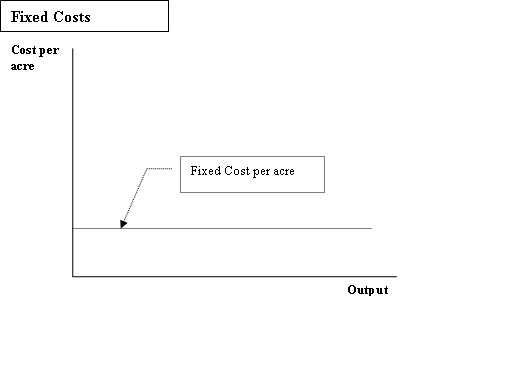
Tech Story: Fixed Costs - Crop Production
Example of fixed costs using crop production examples.
ViewsSelect

Marginal Costs

MarginalCosts
Graphs showing relation between marginal costs and short run supply.
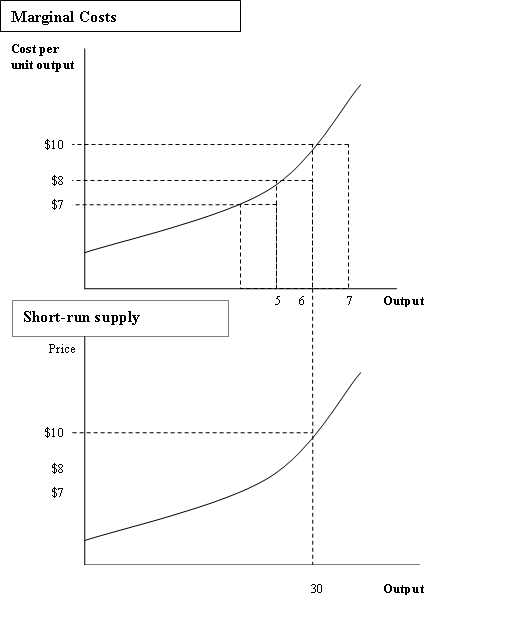
Tech Story: Marginal Costs - Crop Production
Describes marginal costs using crop production examples.
ViewsSelect

Value of Marginal Product

EfficientInputUse
Graph showing that relation between efficient input use, unit revenues and input prices by input quantity.
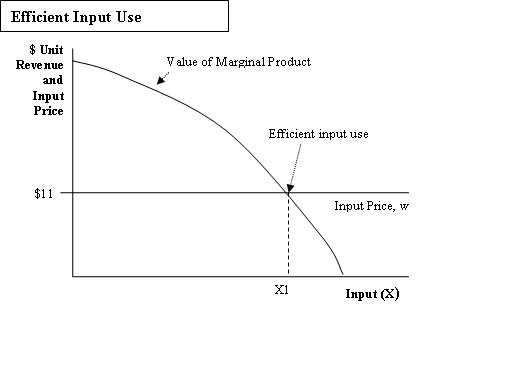
Tech Story: Value of Marginal Product, Crop Production
Defines Value of Marginal Product using crop production examples.
ViewsSelect

Tech Story: Value of Marginal Product, Livestock Production
Defines Value of Marginal Product using livestock examples.
ViewsSelect

Maxmimum Return to Nitrogen

MaximumReturnToN
Graph showing the relation between an economic returns from varying nitrogen rates and the corn - nitrogen price ratio.
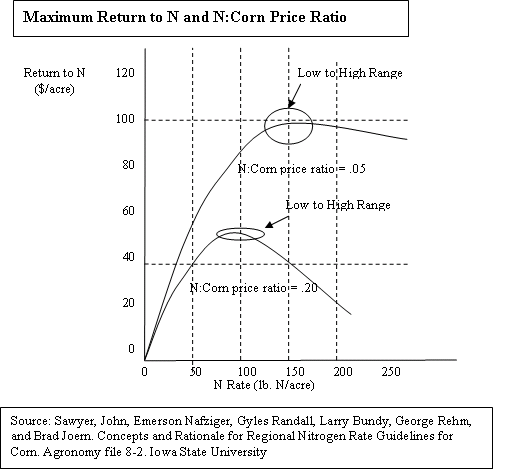
Tech Story: Maxmimum Return to Nitrogen, Crop Production
Defines maximum return to Nitrogen using crop production examples.
ViewsSelect

Tech Story: Maxmimum Return to Nitrogen, Orchard Production
needs description
ViewsSelect

Natural Resource Assets

NaturalResourceAssets
Image showing the value of natural resources as assets.
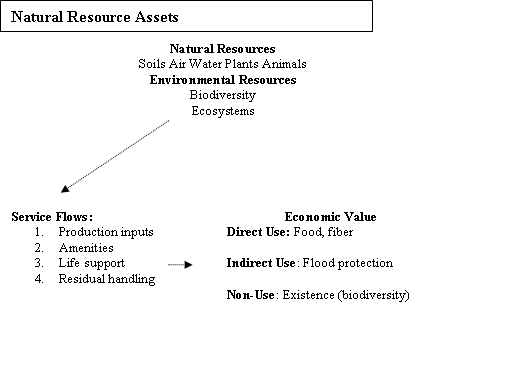
Tech Story: Natural Resource Assets, Crop Production
Describes natural resource assets using crop production examples.
ViewsSelect

Tech Story: Natural Resource Assets, Livestock Production
needs description
ViewsSelect

Nitrogen Yield Production Function

NitrogenResponseFunction
Graph showing the relation between grain yield and nitrogen input use.
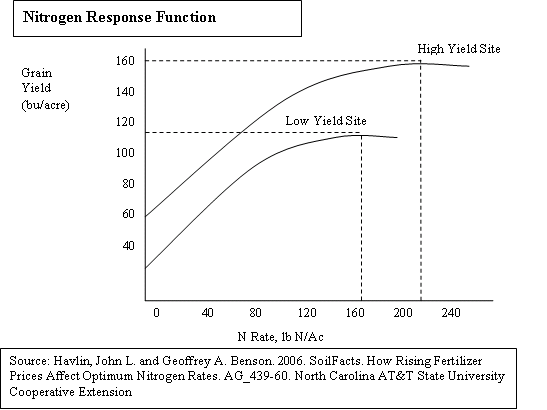
Tech Story: Nitrogen Yield Production Function, Crop Production
Nitrogen Yield Production Function, Crop Production description
ViewsSelect

Tech Story: Nitrogen Yield Production Function, Orchard Production
needs description
ViewsSelect

Production

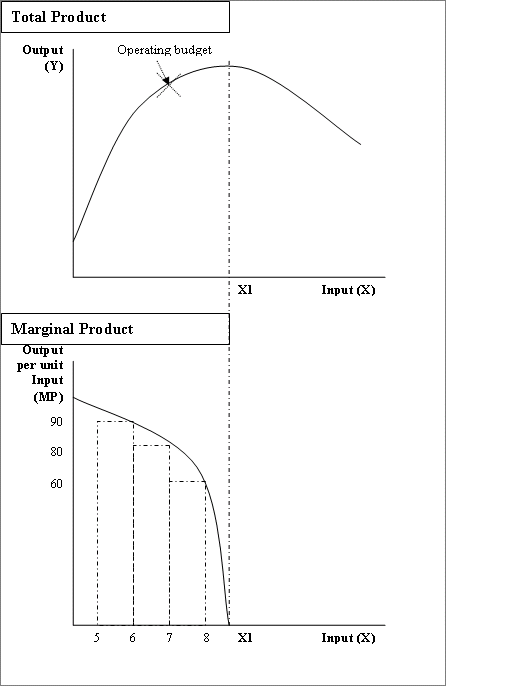
TotalandMarginalProduct
Graphs showing relation between total and marginal products.
Tech Story: Production, Crops
Defines production using crop examples
ViewsSelect

Tech Story: Production, Livestock
needs description
ViewsSelect

Marginal Revenues

TotalRevenue
Graphs showing total revenue for price taking firm.
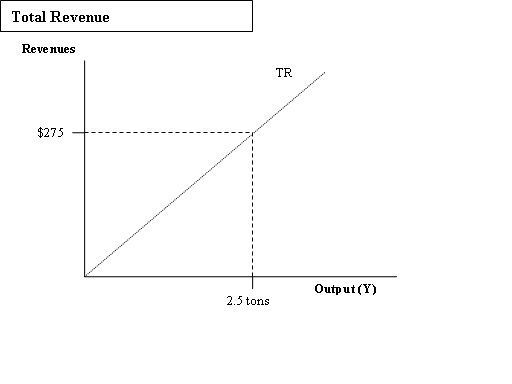
Tech Story: Marginal Revenues, Crop Production
Defines marginal revenues using crop production examples.
ViewsSelect

Tech Story: Marginal Revenues, Livestock Production
needs description
ViewsSelect

Simulation Models, Root Zone Water Quality Model

SimulatedandMeasuredN
Graph plotting simulated and measured nitrogen loading for corn-soybean production in eastern Iowa.
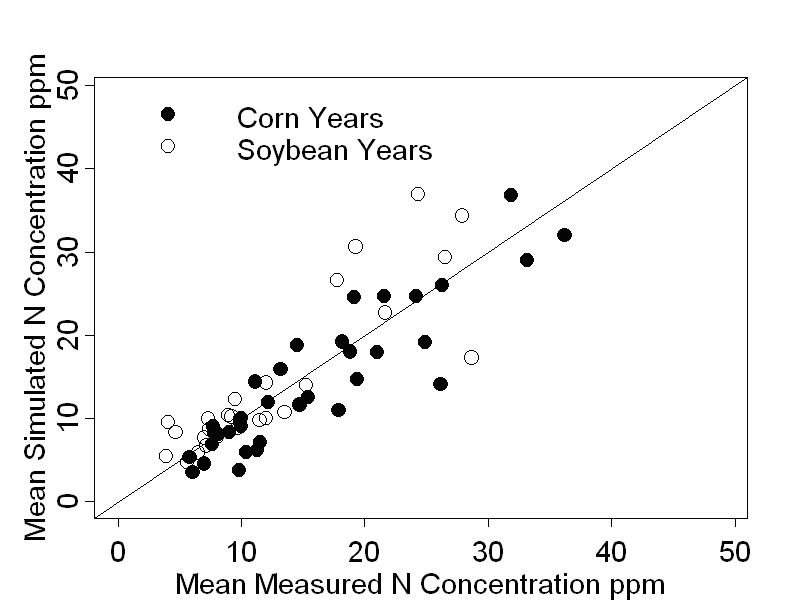
Tech Story: Simulation Models, Root Zone Water Quality Model, Corn Soybeans
Describes simulation models using the Root Zone Water Quality Model and corn and soybeans production.
ViewsSelect

Tech Story: Simulation Models, Root Zone Water Quality Model, Wheat
needs description
ViewsSelect

Synchronize panels by clicking the panel directional buttons found at the top of the panel.

Synchronize panels by clicking the panel directional buttons found at the top of the panel.


Synchronize panels by clicking the panel directional buttons found at the top of the panel.


Uploading a new file will replace any existing file. If necessary, please package and download the existing file prior to this action. If the file has been uploaded successfully, this page will refresh and show the new file information. If the file can't be uploaded (i.e. exceeds 60MB, unsupported mimetype, bad xml, bad html) this page will refresh and show the existing file information.

The file has been uploaded.